
A series of illustrations based on voting, one being statistical, and the other being an "how does this work" step by step graphic. The first being about Registered Voter Turnout in Monroe County, New York, and the other being about the Electoral College Process.
Task/Objective
To create two visualizations based on voting; one being demographic, and the other being an process of something. My objective is to create simple graphics that would be simple, yet easy to understand. For the process piece, my objective is to make the step by step process easy to understand that includes simple illustrations that go along with it.
Final Designs
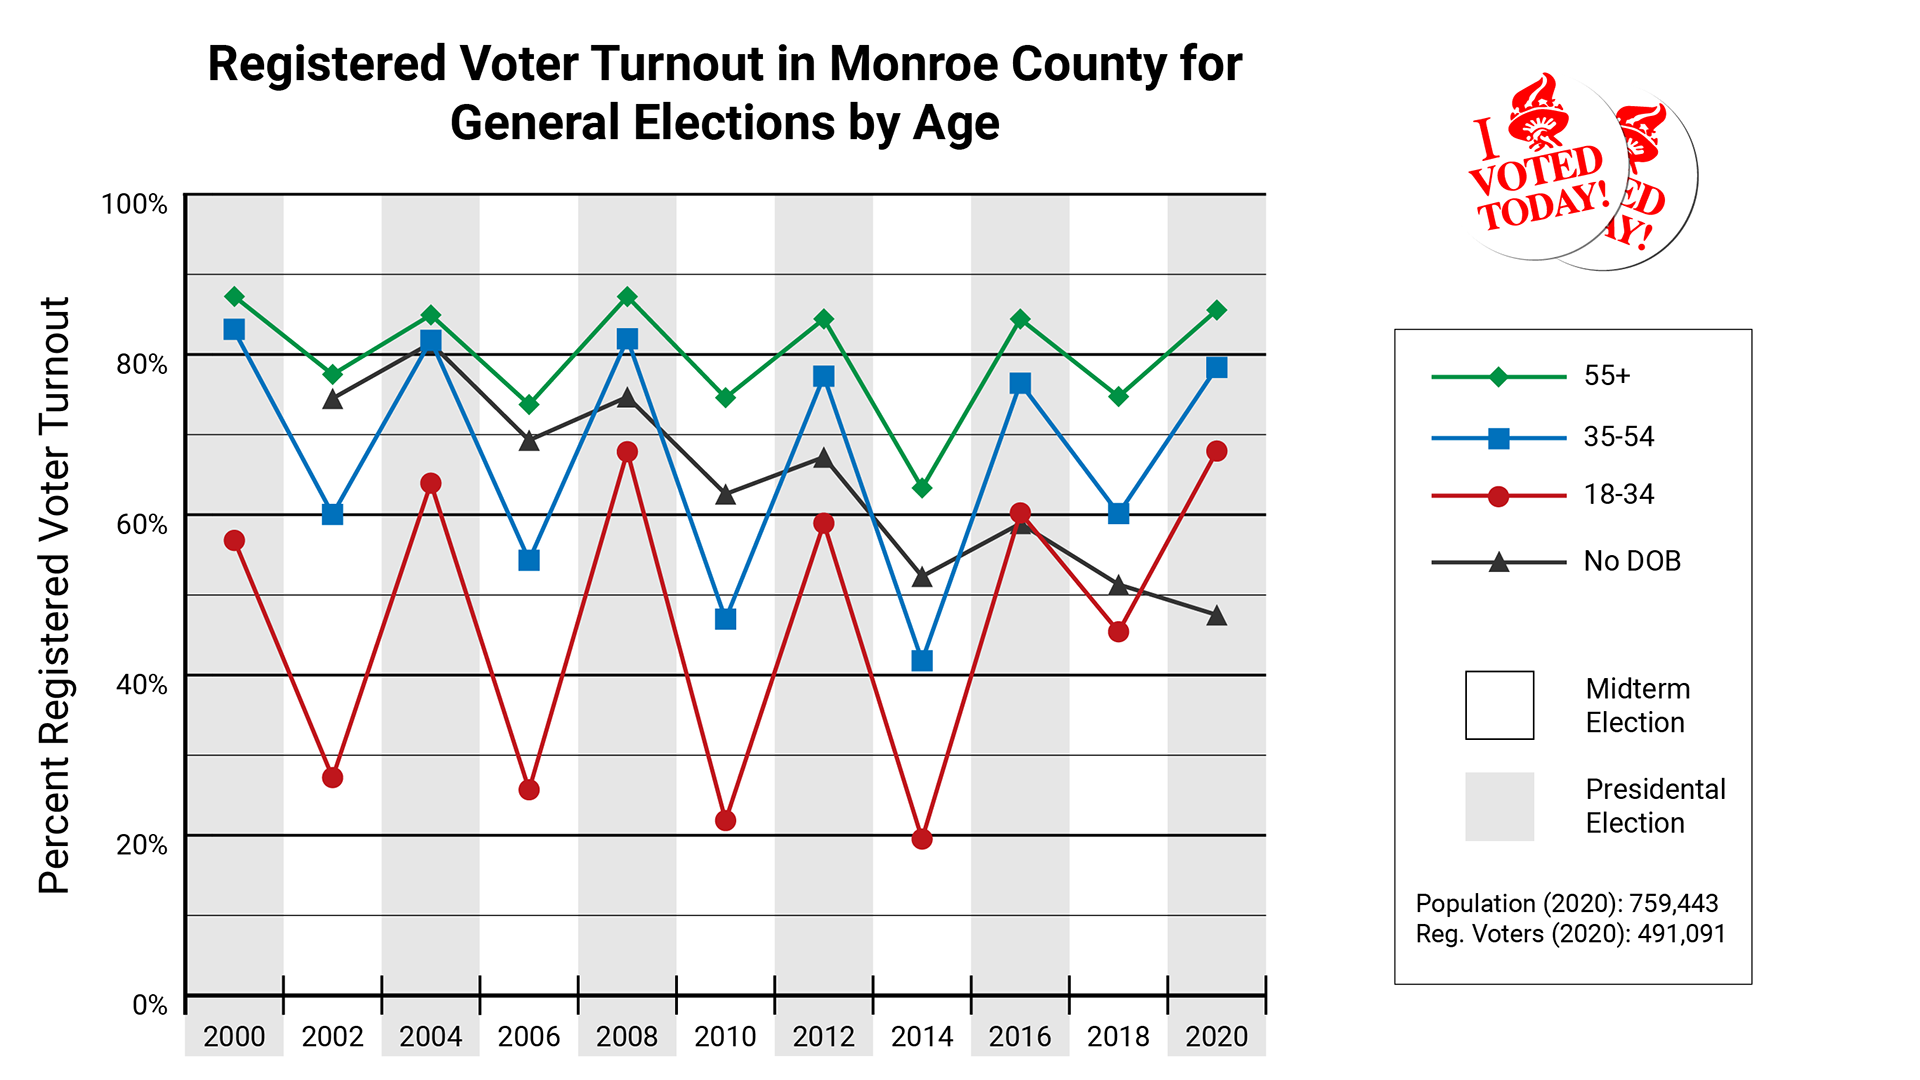
Final chart created on Registered Voter Turnout in Monroe County for General Elections by Age.

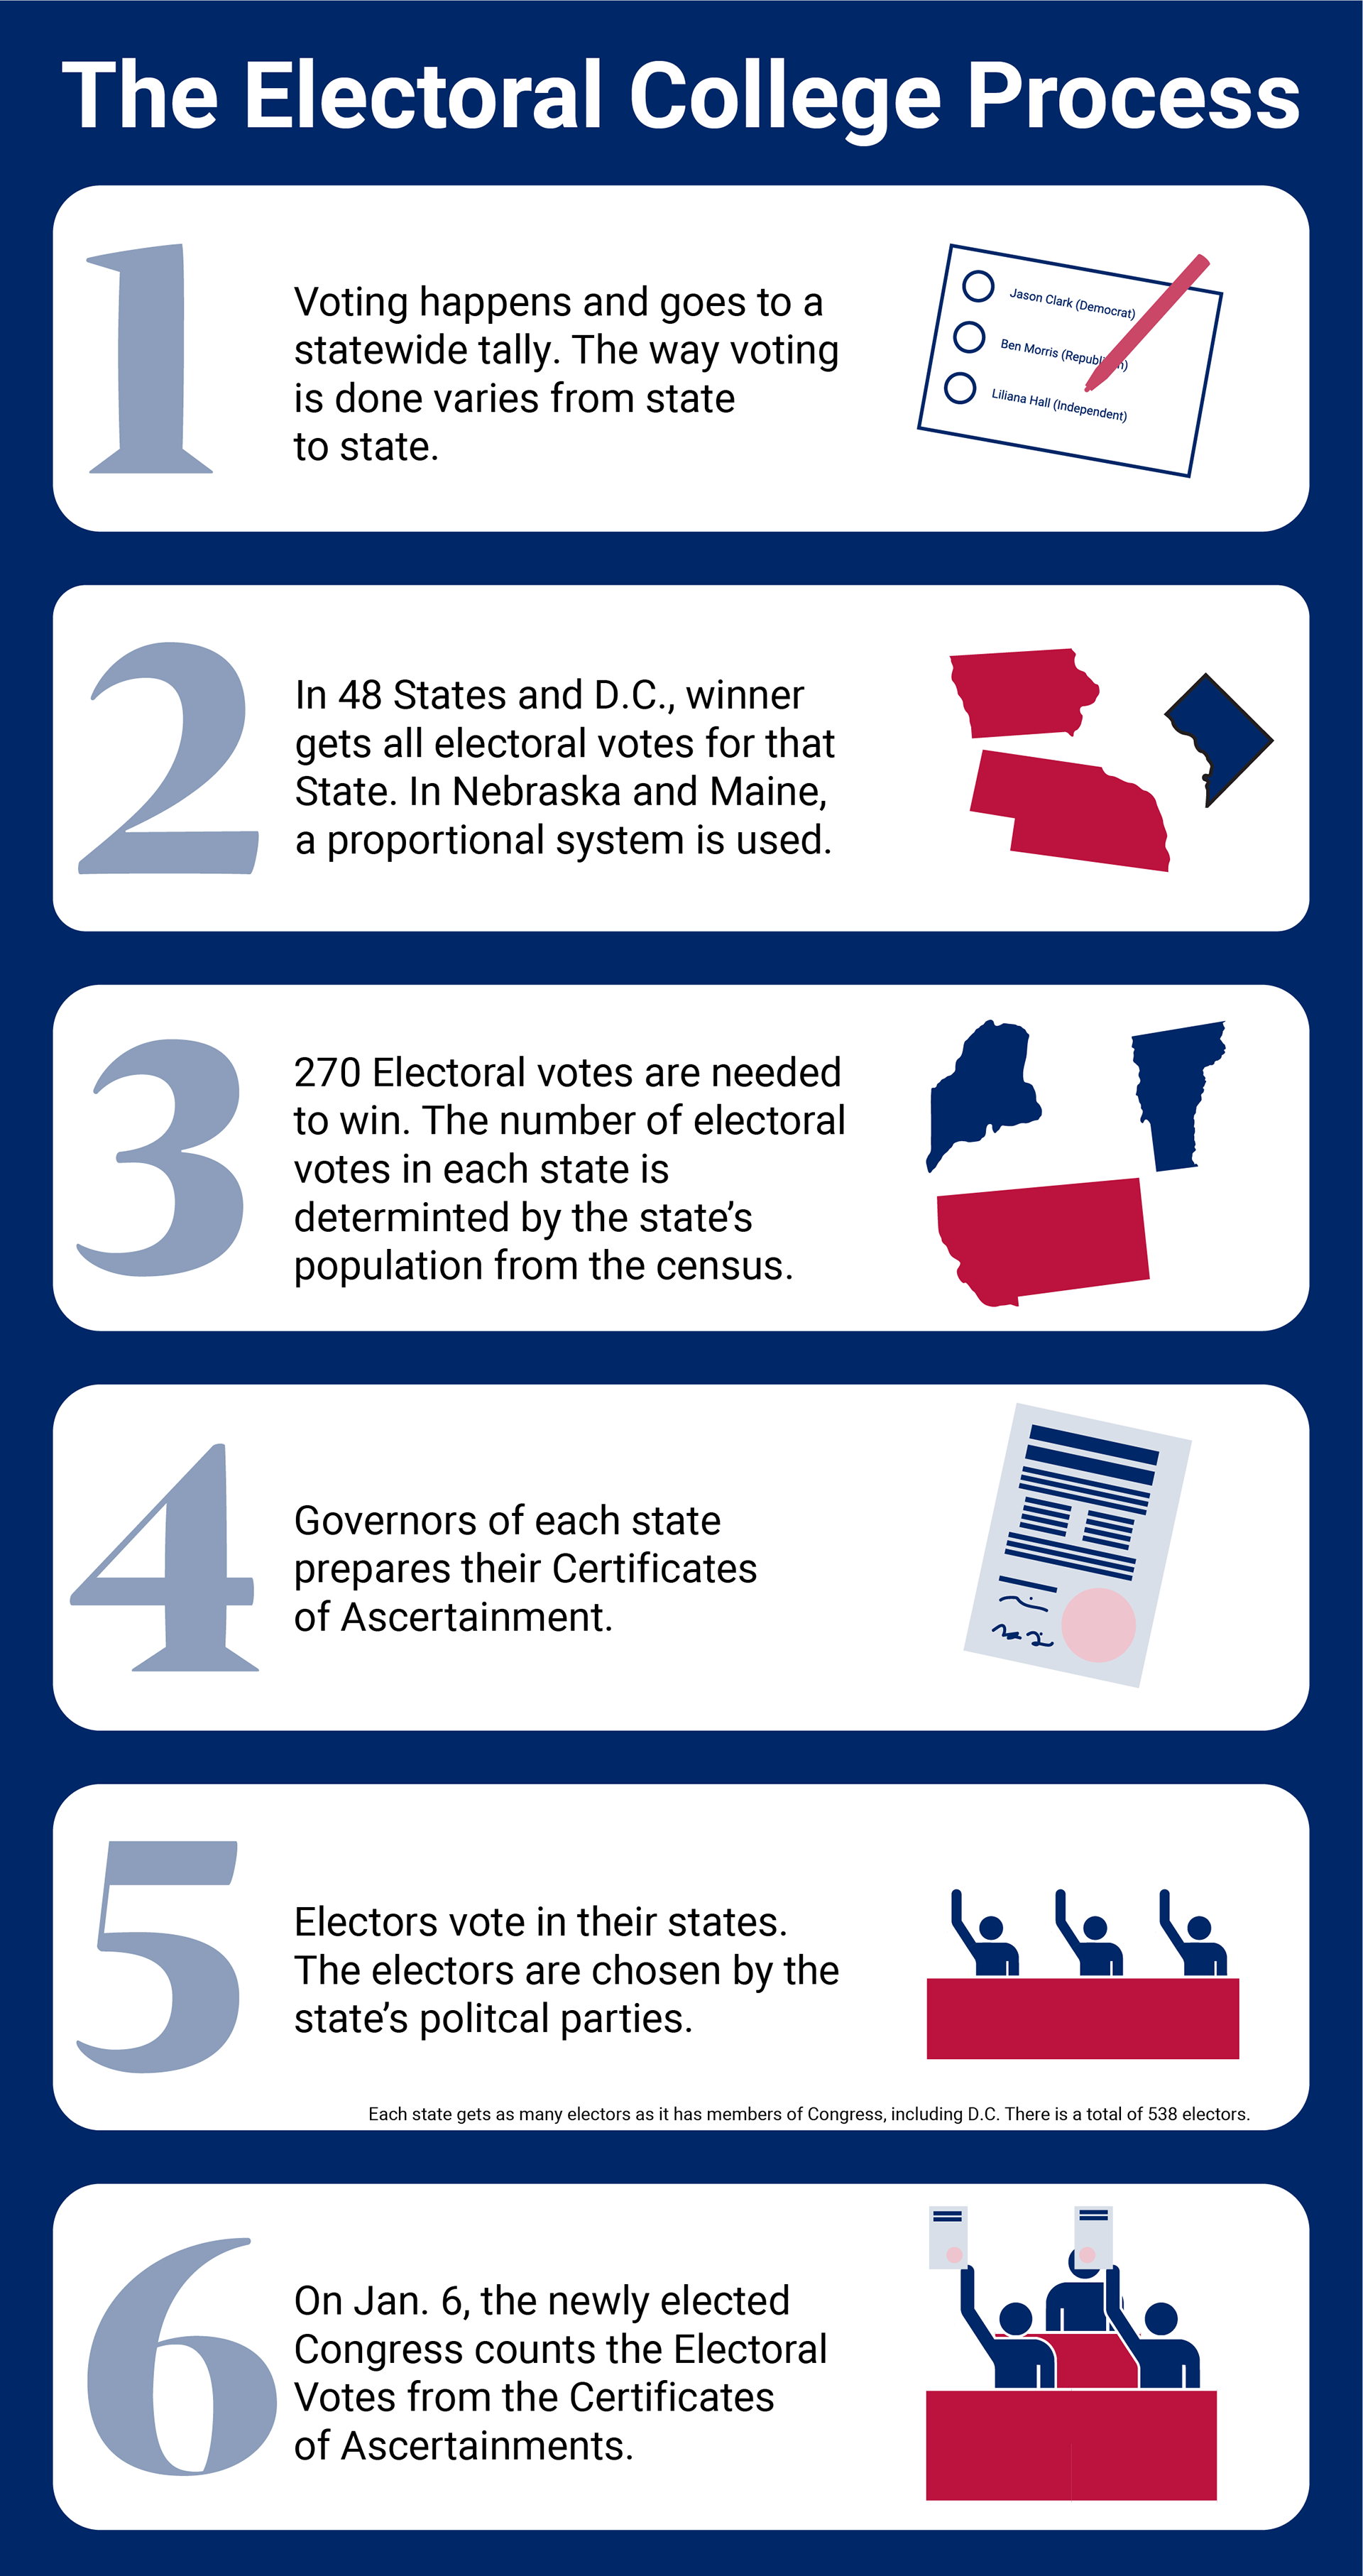
Final infographic created on the Electoral College Process and how the president is elected.
The final video created based off the infographic.
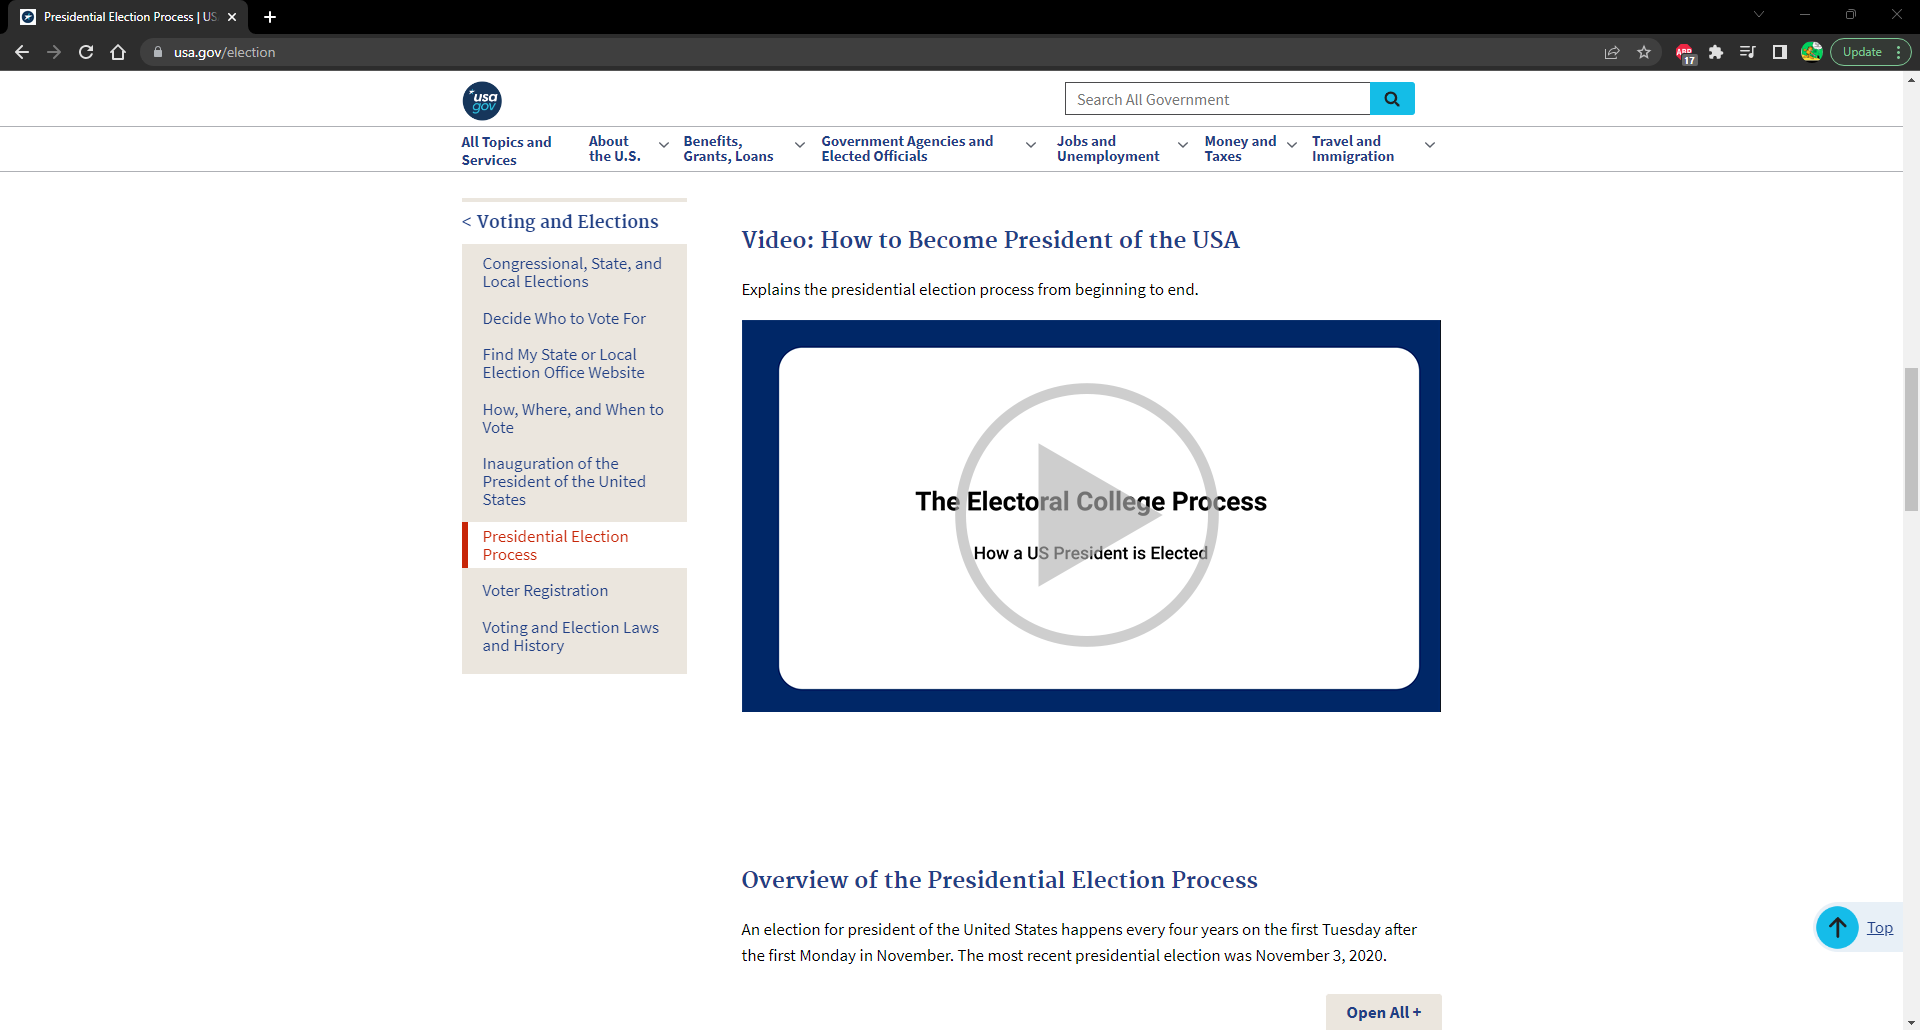
Mock-up of how the video can be used on USA.gov
Music used in video: That Positive Feeling by Alumo